
by Andrew Syrios
There are a plethora of different calculations that can be used to evaluate a potential or completed real estate deal. This article will review those tools with a special interest in the Internal Rate of Return (IRR). When it comes to evaluating a real estate deal, or any investment for that matter, the most all-encompassing tool is the Internal Rate of Return. But like all calculations, IRR has its downsides. The biggest downside of the IRR is that in order to accurately calculate it, the deal must be done and over with. Not just the acquisition, but you must have sold the property, or at least refinanced out of your initial investment, in order to truly know what your IRR was. Otherwise, you have to estimate it on a set of assumptions and thus, it will be susceptible to the accuracy, or inaccuracy, of those assumptions.
Cap Rate: Net Operating Income / Total Cost of Property
The advantage of the cap rate is that it is easy to calculate. It also allows you to compare properties in a similar asset class with differing characteristics that make a direct comparison impossible. For example, say you are comparing two apartment complexes. One is a 100-unit apartment complex with 75 1-bedroom units and 25 2-bedroom units that average 750 square feet. Each unit has old, wooden windows, central air and heat, and the apartment complex has an onsite laundry room and a community swimming pool. The other is an 80-unit apartment complex with 20 1-bedroom units, 50 2-bedroom units and 10 3-bedroom units that average 900 square feet. Each unit has vinyl windows, washer/dryer hookups, but only a furnace. The air conditioning is achieved with window units. There in no swimming pool, but each tenant has a carport to park their car under.
Trying to compare such buildings is much more difficult than comparing two similar dwellings. Thus we have the cap rate, which takes the actual income those buildings produce minus the expenses, and then divides it by the total cost. This is a great tool for comparing such assets (as long as they are in a relatively similar class and area).
The disadvantage is that a cap rate is only a snap shot. It says nothing about the expected growth in rents, expenses, or property value. It also says nothing about whether using leverage will increase your return.
Cash-on Cash-Return: Cash Flow / Total Cash Invested
Cash-on-cash return is also simple to calculate and tells you what your return will be in the first year of holding the property. This is a great calculation for investors who are intent on holding a property. It is also helpful when deciding whether to use leverage, and what kind of leverage, as you can easily calculate what kind of change your cash-on-cash will have when you reduce your cash invested by adding debt, and reduce your cash flow by the accompanying debt service.
Again, however, cash on cash is only a one year snapshot. It doesn’t take into account disposition or refinancing as well as changes to income or expenses that might alter your cash flow in the years to come.
Rent-to-Cost Yield: Monthly Rent / Total Cost of Property & Gross Yield: Total Cost of Property / Annual Rent
Both of these calculations are basically the same, just flipped around. I hear rent-to-cost used almost exclusively amongst normal investors, while I hear gross yield discussed amongst institutional investors. This calculation’s primary advantage is in how easy it is to calculate. On the other hand, there are so many variables left out (expenses, debt, etc.) that it should only be seen as a shorthand tool and not an in-depth analysis.
Gross Rent Multiplier: Gross Annual Rents / Total Cost of Property
Gross rent multiplier is very similar to the rent-to-cost or gross-yield calculation. It is easy to calculate and can be useful for quickly evaluating whether a property is worth looking at. However, it leaves to much out to be a satisfactory way to evaluate a potential investment in and of itself.

Return on Investment (ROI): (Gain on Investment – Cost of Investment) / Cost of Investment
Now we’re starting to get the whole picture. Return on investment and the internal rate of return act more like a film of the entire investment, while the above calculations are akin to pictures taken at the beginning. With regards to ROI, say you invested $100,000 and made $50,000 plus your principal, your ROI would be equal to ($150,000 – $100,000) / $100,000, or 50%.
That sounds like a good investment, but of course if it took you 50 years to make that kind of return, then not so much. You can get an annualized rate by simply dividing your ROI by the number of years you had the investment. In the above case it would be 50% / 50, which equals 1%.
Return on investment is beneficial for analyzing how well a deal did in the past. This type of measuring is always important, as you can’t fine tune your investing in the future unless you know how your investments have done in the past. Of course, when using ROI to analyze whether or not to buy a property, it’s only as good as your assumptions you put into it.
Internal Rate of Return
For the most precise evaluation of how an investment performed, we turn to the IRR. The definition of IRR is a bit technical, so I’ll let Ben Leybovich explain it: “For the other hard-core finance geeks out there, IRR is most specifically defined as the discount rate that makes an investment’s net present value (NPV) equal to 0.” Here’s the math from Wikipedia:

So now that everyone understands IRR, my job is done, have a great week everybody!
What, that explanation wasn’t sufficient? Fine, we’ll go into a bit more detail. As I explained in my previous article, IRR can be a very powerful calculation because it accounts for the fact that each year can have a different cash flow, and that the sooner money is earned, the more it is worth. Think about it this way, would you rather have $10,000 today or five years from now? Given that if you get the money now, you can invest that $10,000 and make a healthy return for five years, the correct answer is you would want the $10,000 now. Money now is worth more than money later.
So what the IRR is calculating is what your “annual effective compounded return rate” is, or in other words, what your average return is when taking into account when you have cash inflows and outflows.
Let’s say you are looking at a deal with the following assumptions:
- Purchase Price and Costs to Close: $200,000
- No Leverage
- First Year Net Operating Income: $20,000
- Annual Growth Rate of Net Operating Income: 2%
- Year 5 Capital Improvements (new roofs, HVAC, etc.): $50,000
- Disposition Price minus costs (end of year 10): $300,000
You can do this calculation in a spreadsheet using the formula =IRR() or you can use one of the many IRR calculators online, such as this one. Here’s what you get:
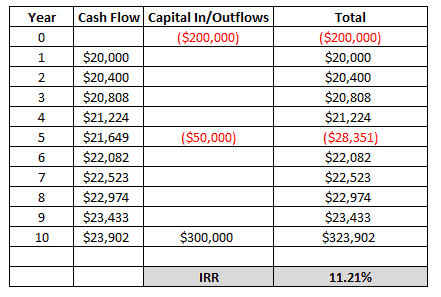
Your IRR equals 11.21%, before tax of course.
Now here’s why this is important. Let’s compare that to your Return on Investment. The total of your return is $468,994. So if we calculate the ROI, we get the following:
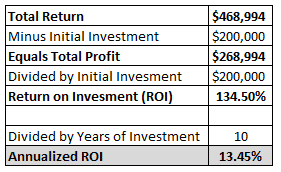
As you can see, the ROI is over 2% higher than the IRR. The reason for this is such a large chunk of the money came in at the end when the property was sold. As we noted above, money is worth more now than later, so your internal rate of return is reduced. The IRR accounts for when money comes in and out, whereas the ROI does not.
Also, as noted above, we can use IRR to evaluate what effect leverage will have on an investment. So let’s add debt to our equation:
- $150,000 Loan (with $5000 loan fees)
- So $55,000 total cash investment
- $10,000 Annual Debt Service
- You will have paid off $25,000 in principal on the note after 10 years (so your profit will be $300,000 – $125,000 = $175,000). You can figure out how much principal will be paid off by viewing an amortization schedule which you can find with any mortgage calculator, such as the one at Bankrate.com.
Then we run the numbers again. (Remember, your debt service doesn’t change, so the net operating income growth is more than 2 percent as the expanded table shows.)
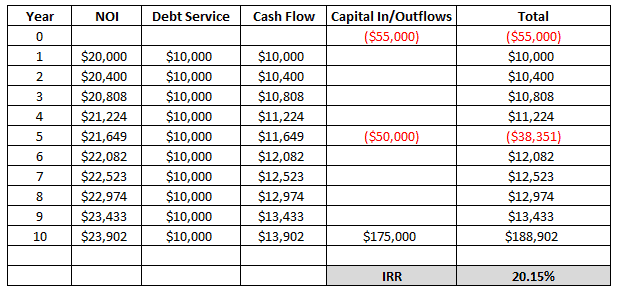
As you can see, leverage almost doubles your IRR up to 20.15 percent. (The annual ROI skyrockets even more to 34.36 percent.) But of course, leverage makes everything more risky, so that needs to be taken into account as well.
Conclusion
IRR is a great tool to evaluate how well your investments have done and also find which types of investments (single family, multifamily, offices, etc.) or areas have been the most successful. However, in using it as a tool to predict the future, I must preach caution. There are plenty of websites and firms that will offer forecasting, and while I’m fully in favor of using those servies, I would always warn against relying on them. Make sure to use very cautious and conservative assumptions for appreciation of rents and the property’s value, especially if you intend to use financing.
But that being said, it is crucial to value properties before you acquire them. It’s also imperative to evaluate how you did during (and after) you’ve either sold or refinanced. Only by doing this can you both reduce the risk of making a mistake while fine tuning your investment and evaluation criteria. Math only sucks when you can’t make money using it.
Interested in Finding out More? Reach out below
Shawn Ireland
Phone: 913-225-6231
Email: Ireland_Investments@yahoo.com
Address: 1415 Main St. #823, Grandview, MO 64030
Website: www.irelandinvestmentsllc.com/
Facebook: @IrelandInvestmentsLLC/
Instagram: @irelandinvestmentsllc
Twitter: @IrelandLlc
Ireland Investments llc
This information is intended only for the use of the intended recipient(s) and it may be privileged and confidential. Please note that any views or opinions presented in this post are solely those of the author and do not necessarily represent those of the company. This is reposted information and is not original thought of Ireland Investments or anyone associated with the business.
Popular areas we service;
Crossroads Real estate, 18th and vine Real estate, Hospital Hill real estate, library district real estate, longfellow real estate, dutch hill real estate, quality hill real estate, river market real estate union hill real estate, Greater downtown KCMO real estate, East Side KCMO real estate, Midtown KCMO real estate, Westport Real estate, Hyde Park real estate, Northeast KCMO real estate, Northland real estate, Plaza Real estate, South Kansas City Real estate, Fairway Kansas real estate, Kansas city Kansas real estate, lake quivira Kansas real estate, Lenexa Kansas real estate, Mission hills Kansas real estate, overland park Kansas real estate, prairie village Kansas real estate, Shawnee Kansas real estate, weatherby lake Missouri real estate, westwood Kansas real estate

Leave a comment